Skynet is defeated!

TLDR
A beautiful example of hyperacute t waves that could be identified from single ECG but was made much easier by comparison with prior.
The signs highlighted in this case:
ST segment flattening / sagging
Symmetry of TW
Loss of concave contour of TW
Proportionally or Relatively larger TW (taking into account the QRS amplitude)\
Subtle QT prolongation
Flipping through a stack this one stood out
The inferolateral t waves were symmetric, pyramid like, with a flat st segment runway, concerning for ischemia.
The chief complaint checked out too: 45 year old M presenting with chest pain x 1 d.

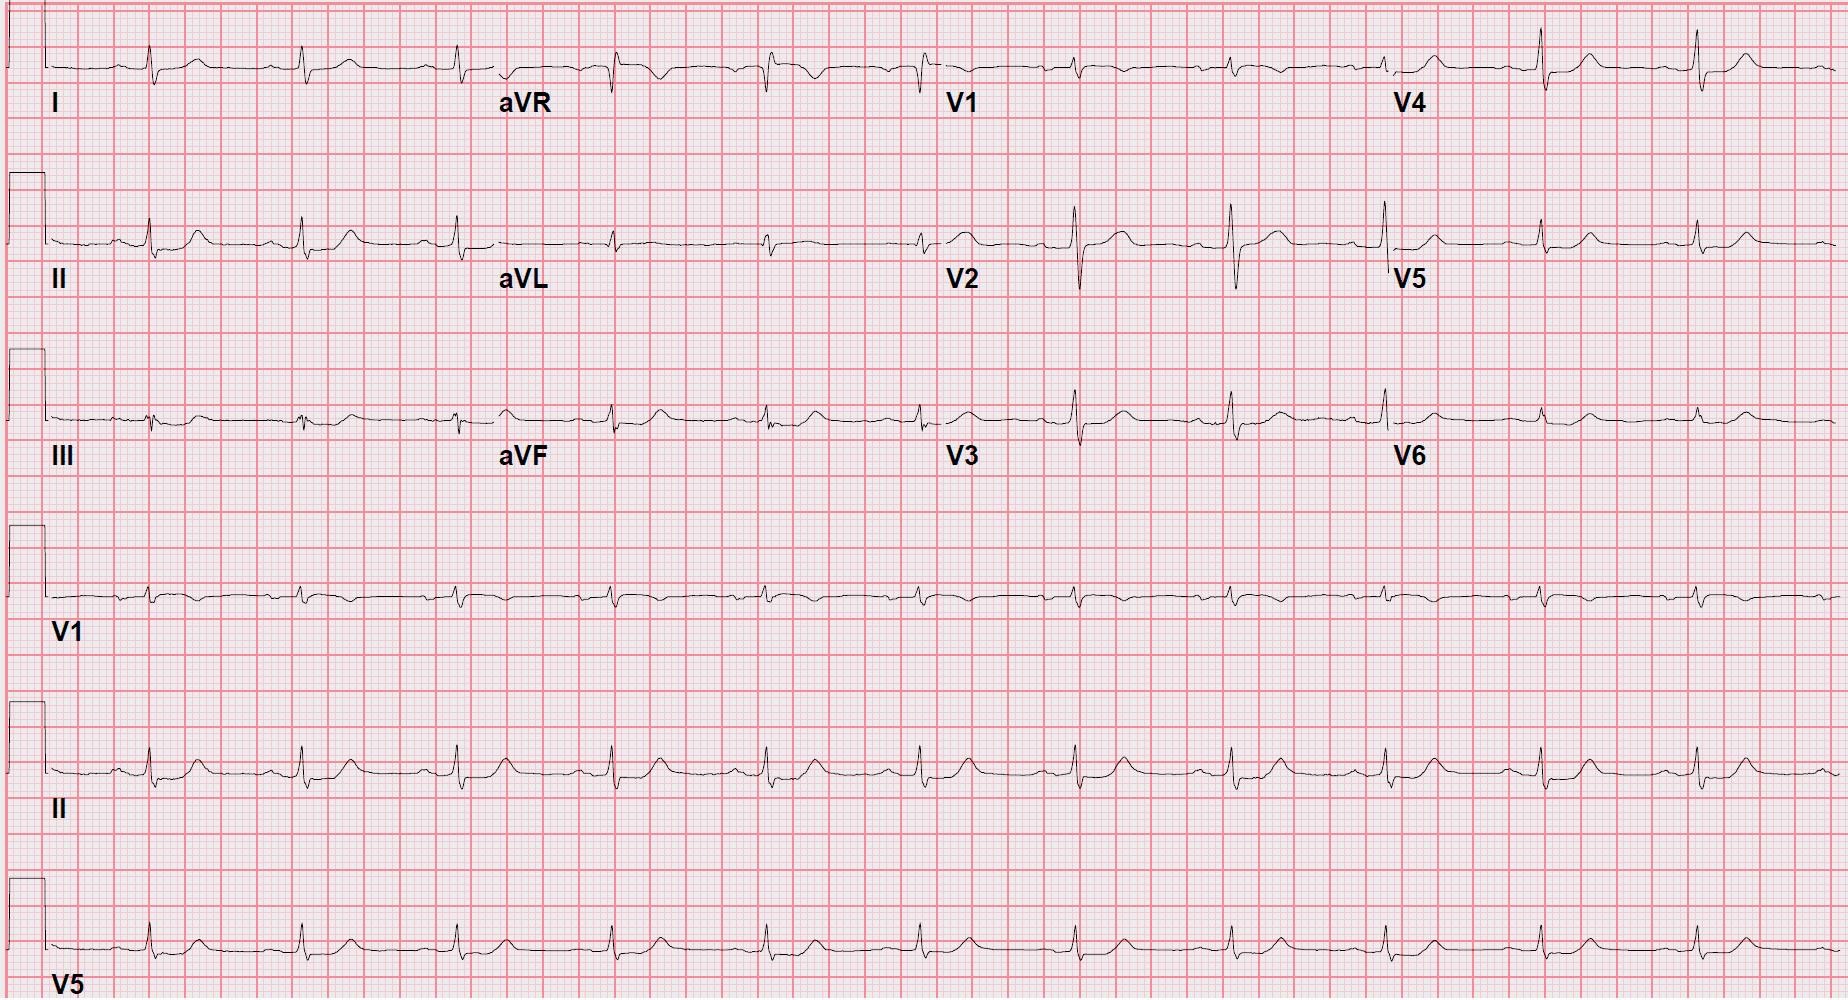
ED ECG #1 (Click to enlarge ESC to return)
I moved on to see if any prior ecgs and was happy to find several. Here’s one.

Prior baseline ecg. Click once to enlarge and again to return.
Prior ecg confirmed shady t waves .
To be more specific, they were consistent w/ hyperacute T waves and not even very subtle when compared to the prior ecgs. Alone without the prior ecg it would've been high on my differential but would've lacked the confidence at an early stage.
Here is a summary of the (II, III, aVF, and V4-V6) differences I appreciated:
I have included all tracings uploaded to make a comparison easier. See image below.
Prior ecg:
Asymmetric TW - the upstroke taking it's time and slowly rising to the peak while the downslope is more rapid.
ST segments without flattening or sagging. Instead a greater percentage is actually part of the T wave and slowly rising.
The T wave overall contour is more concave appearing due to the above two points.
Smaller T waves relatively. Meaning smaller in proportion to QRS . (T wave amplitude/QRS amplitude)
Today's ecg:
Symmetric. Pyramid like. The upstroke is about the same duration as the downstroke.
ST segment appears longer (objectively qt longer than prior ecg) and importantly is flattened or with sagging appearance.
The T wave lacks concavity due to the above two points and appears straightened or "inflated."
Relatively large T wave (T wave amplitude/ QRS)
Remember to always take proportionality into account when talking about size or amplitude. Although the T waves appear "small" in the inferolateral leads they are as tall or taller than QRS!
The concept of inflating or blowing air into the t wave can be better visualized by cartoon found on Lifesaver Loot section of website/ play card.

Freehand trace to highlight t wave changes between prior and new ecg.
ED Course
On evaluation patient was chest pain free since arriving to hospital. I explained my concerns regarding ecg and typical anginal symptoms experienced and started ACS medications. They were told to call immediately if onset of any symptoms. Around time of heparin bolus/drip the initial troponin-hs resulted minimally elevated low 100s.
Cardiology fellow (in house) was consulted but cath lab was not activated via stemi protocol. This was despite my concern w/ ecg due to him being asymptomatic. I made my case for him getting a morning cath, now just a couple hours away, and was successful in my convincing and he was placed on the schedule.

See the serial changes in ECGs below. In V4-V6 I think it's easiest to appreciate the dramatic differences between his prior and this visit. Click once to enlarge. Again to dismiss.

Complete 2nd ED ECG. Click to enlarge. Click again on image to dismiss.
Less than an hour later patient developed chest pain.
Previously very adamant had none at all since in hospital. For this reason had not been given any pain medications earlier nor NTG intentionally but told to alert me. The ecg was repeated q 30 min x 2. Chest pain described as moderate very briefly at onset and minutes later by my arrival was minimal and became only discomfort then disappearing after 4mg IVP morphine.
I called interventionalist directly to expedite patient to cath lab and they agreed to plan for immediate cath. Of note 2 ecg were sent to Queen of Hearts and both returned result of not OMI, high confidence. In addition, a repeat early +2 hr troponin resulted still low 100s relatively similar to initial. (124->148).
Complete 3rd ED ECG. Click once to enlarge. Again to dismiss.
From cardiology via text:
"Everything was IVUS guided. Shockwaves for RCA. Stent OMB and RCA." Overall was very pleased with case and said "amazing final results."
It seemed everything went well. But it does beg the question, should I have acted sooner and with as much haste as a "STEMI" activation (i.e. cath lab team woken and en route prior to interventionalist even returning my call). Or was a couple of hours, the great majority of which was spent asymptomatic just fine. One could argue the low troponin supported the strategy I used. But, I don't put much weight on a test with that much lag. I'll have to follow the future echo to feel as great about the outcome as cardiology did.
Overall this is a classic hyperacute t wave case that is pretty easy to pick up which compared to prior ecg. It also is the first time I have outsmarted that damn Queen of Hearts app and I can't help wonder if the high confidence in the Queen biased me in any way.
Finally, it's a good jumping off point to discuss OMI vs STEMI/NSTEMI. I recognized this in a stack quickly but it got treated, although still fast, slower than a STEMI. Something seems off about that.
I am still pretty newish getting to know cardiologists at my current shop and previously have relied on the relationships I built through cases to be able to move the non STEMI—but OMI cases. So I expect to be in the same place here soon.
But how to make the hyperacute t wave into something maybe more quantifiable to fit into a protocol so a new ED doc stepping can activate a stemi protocol with as much confidence as one who spent a year building the relationships?
Maybe it's nothing quantifiable or measurable but just an increase in education. Honestly, I don't bring a ruler to work and don't plan to start … but once I saw a few cases it started to come much easier than I thought. The symmetry of the t wave is something that strikes me just as hard as an st elevation when even glancing over an ecg. If this case seemed hard or scary it's probably just because these concepts were never taught to you at all—at least this was the case for me.
Special thanks to Dr. Steve Smith and his truly amazing blog for being my first teacher in this stemi equivalent, the hyperacute t wave. Highly reccomend his video lectures on blog as well as the blog in general for the best education on this topic.
Additional links and resources can be found on the LifeSaver Loot page under Hyperacute T Wave.

Complete 2nd ED ECG. Click to enlarge. Click again on image to dismiss.


Skynet is defeated!
TLDR
A beautiful example of hyperacute t waves that could be identified from single ECG but was made much easier by comparison with prior.
The signs highlighted in this case:
ST segment flattening / sagging
Symmetry of TW
Loss of concave contour of TW
Proportionally or Relatively larger TW (taking into account the QRS amplitude)\
Subtle QT prolongation
Flipping through a stack this one stood out
The inferolateral t waves were symmetric, pyramid like, with a flat st segment runway, concerning for ischemia.
The chief complaint checked out too: 45 year old M presenting with chest pain x 1 d.
ED ECG #1 (Click to enlarge ESC to return)
I moved on to see if any prior ecgs and was happy to find several. Here’s one.
Prior baseline ecg. Click once to enlarge and again to return.
Prior ecg confirmed shady t waves .
To be more specific, they were consistent w/ hyperacute T waves and not even very subtle when compared to the prior ecgs. Alone without the prior ecg it would've been high on my differential but would've lacked the confidence at an early stage.
Here is a summary of the (II, III, aVF, and V4-V6) differences I appreciated:
I have included all tracings uploaded to make a comparison easier. See image below.
Prior ecg:
Asymmetric TW - the upstroke taking it's time and slowly rising to the peak while the downslope is more rapid.
ST segments without flattening or sagging. Instead a greater percentage is actually part of the T wave and slowly rising.
The T wave overall contour is more concave appearing due to the above two points.
Smaller T waves relatively. Meaning smaller in proportion to QRS . (T wave amplitude/QRS amplitude)
Today's ecg:
Symmetric. Pyramid like. The upstroke is about the same duration as the downstroke.
ST segment appears longer (objectively qt longer than prior ecg) and importantly is flattened or with sagging appearance.
The T wave lacks concavity due to the above two points and appears straightened or "inflated."
Relatively large T wave (T wave amplitude/ QRS)
Remember to always take proportionality into account when talking about size or amplitude. Although the T waves appear "small" in the inferolateral leads they are as tall or taller than QRS!
The concept of inflating or blowing air into the t wave can be better visualized by cartoon found on Lifesaver Loot section of website/ play card.
Freehand trace to highlight t wave changes between prior and new ecg.
ED Course
On evaluation patient was chest pain free since arriving to hospital. I explained my concerns regarding ecg and typical anginal symptoms experienced and started ACS medications. They were told to call immediately if onset of any symptoms. Around time of heparin bolus/drip the initial troponin-hs resulted minimally elevated low 100s.
Cardiology fellow (in house) was consulted but cath lab was not activated via stemi protocol. This was despite my concern w/ ecg due to him being asymptomatic. I made my case for him getting a morning cath, now just a couple hours away, and was successful in my convincing and he was placed on the schedule.
See the serial changes in ECGs below. In V4-V6 I think it's easiest to appreciate the dramatic differences between his prior and this visit. Click once to enlarge. Again to dismiss.
Complete 2nd ED ECG. Click to enlarge. Click again on image to dismiss.
Less than an hour later patient developed chest pain.
Previously very adamant had none at all since in hospital. For this reason had not been given any pain medications earlier nor NTG intentionally but told to alert me. The ecg was repeated q 30 min x 2. Chest pain described as moderate very briefly at onset and minutes later by my arrival was minimal and became only discomfort then disappearing after 4mg IVP morphine.
I called interventionalist directly to expedite patient to cath lab and they agreed to plan for immediate cath. Of note 2 ecg were sent to Queen of Hearts and both returned result of not OMI, high confidence. In addition, a repeat early +2 hr troponin resulted still low 100s relatively similar to initial. (124->148).
Complete 3rd ED ECG. Click once to enlarge. Again to dismiss.
From cardiology via text:
"Everything was IVUS guided. Shockwaves for RCA. Stent OMB and RCA." Overall was very pleased with case and said "amazing final results."
It seemed everything went well. But it does beg the question, should I have acted sooner and with as much haste as a "STEMI" activation (i.e. cath lab team woken and en route prior to interventionalist even returning my call). Or was a couple of hours, the great majority of which was spent asymptomatic just fine. One could argue the low troponin supported the strategy I used. But, I don't put much weight on a test with that much lag. I'll have to follow the future echo to feel as great about the outcome as cardiology did.
Overall this is a classic hyperacute t wave case that is pretty easy to pick up which compared to prior ecg. It also is the first time I have outsmarted that damn Queen of Hearts app and I can't help wonder if the high confidence in the Queen biased me in any way.
Finally, it's a good jumping off point to discuss OMI vs STEMI/NSTEMI. I recognized this in a stack quickly but it got treated, although still fast, slower than a STEMI. Something seems off about that.
I am still pretty newish getting to know cardiologists at my current shop and previously have relied on the relationships I built through cases to be able to move the non STEMI—but OMI cases. So I expect to be in the same place here soon.
But how to make the hyperacute t wave into something maybe more quantifiable to fit into a protocol so a new ED doc stepping can activate a stemi protocol with as much confidence as one who spent a year building the relationships?
Maybe it's nothing quantifiable or measurable but just an increase in education. Honestly, I don't bring a ruler to work and don't plan to start … but once I saw a few cases it started to come much easier than I thought. The symmetry of the t wave is something that strikes me just as hard as an st elevation when even glancing over an ecg. If this case seemed hard or scary it's probably just because these concepts were never taught to you at all—at least this was the case for me.
Special thanks to Dr. Steve Smith and his truly amazing blog for being my first teacher in this stemi equivalent, the hyperacute t wave. Highly reccomend his video lectures on blog as well as the blog in general for the best education on this topic.
Additional links and resources can be found on the LifeSaver Loot page under Hyperacute T Wave.
Complete 2nd ED ECG. Click to enlarge. Click again on image to dismiss.